


See exactly how your warehouse works
See how your packing goes and how your business performs.
- Who packed what
- How fast you pack
- Team and organization
- Sales figures
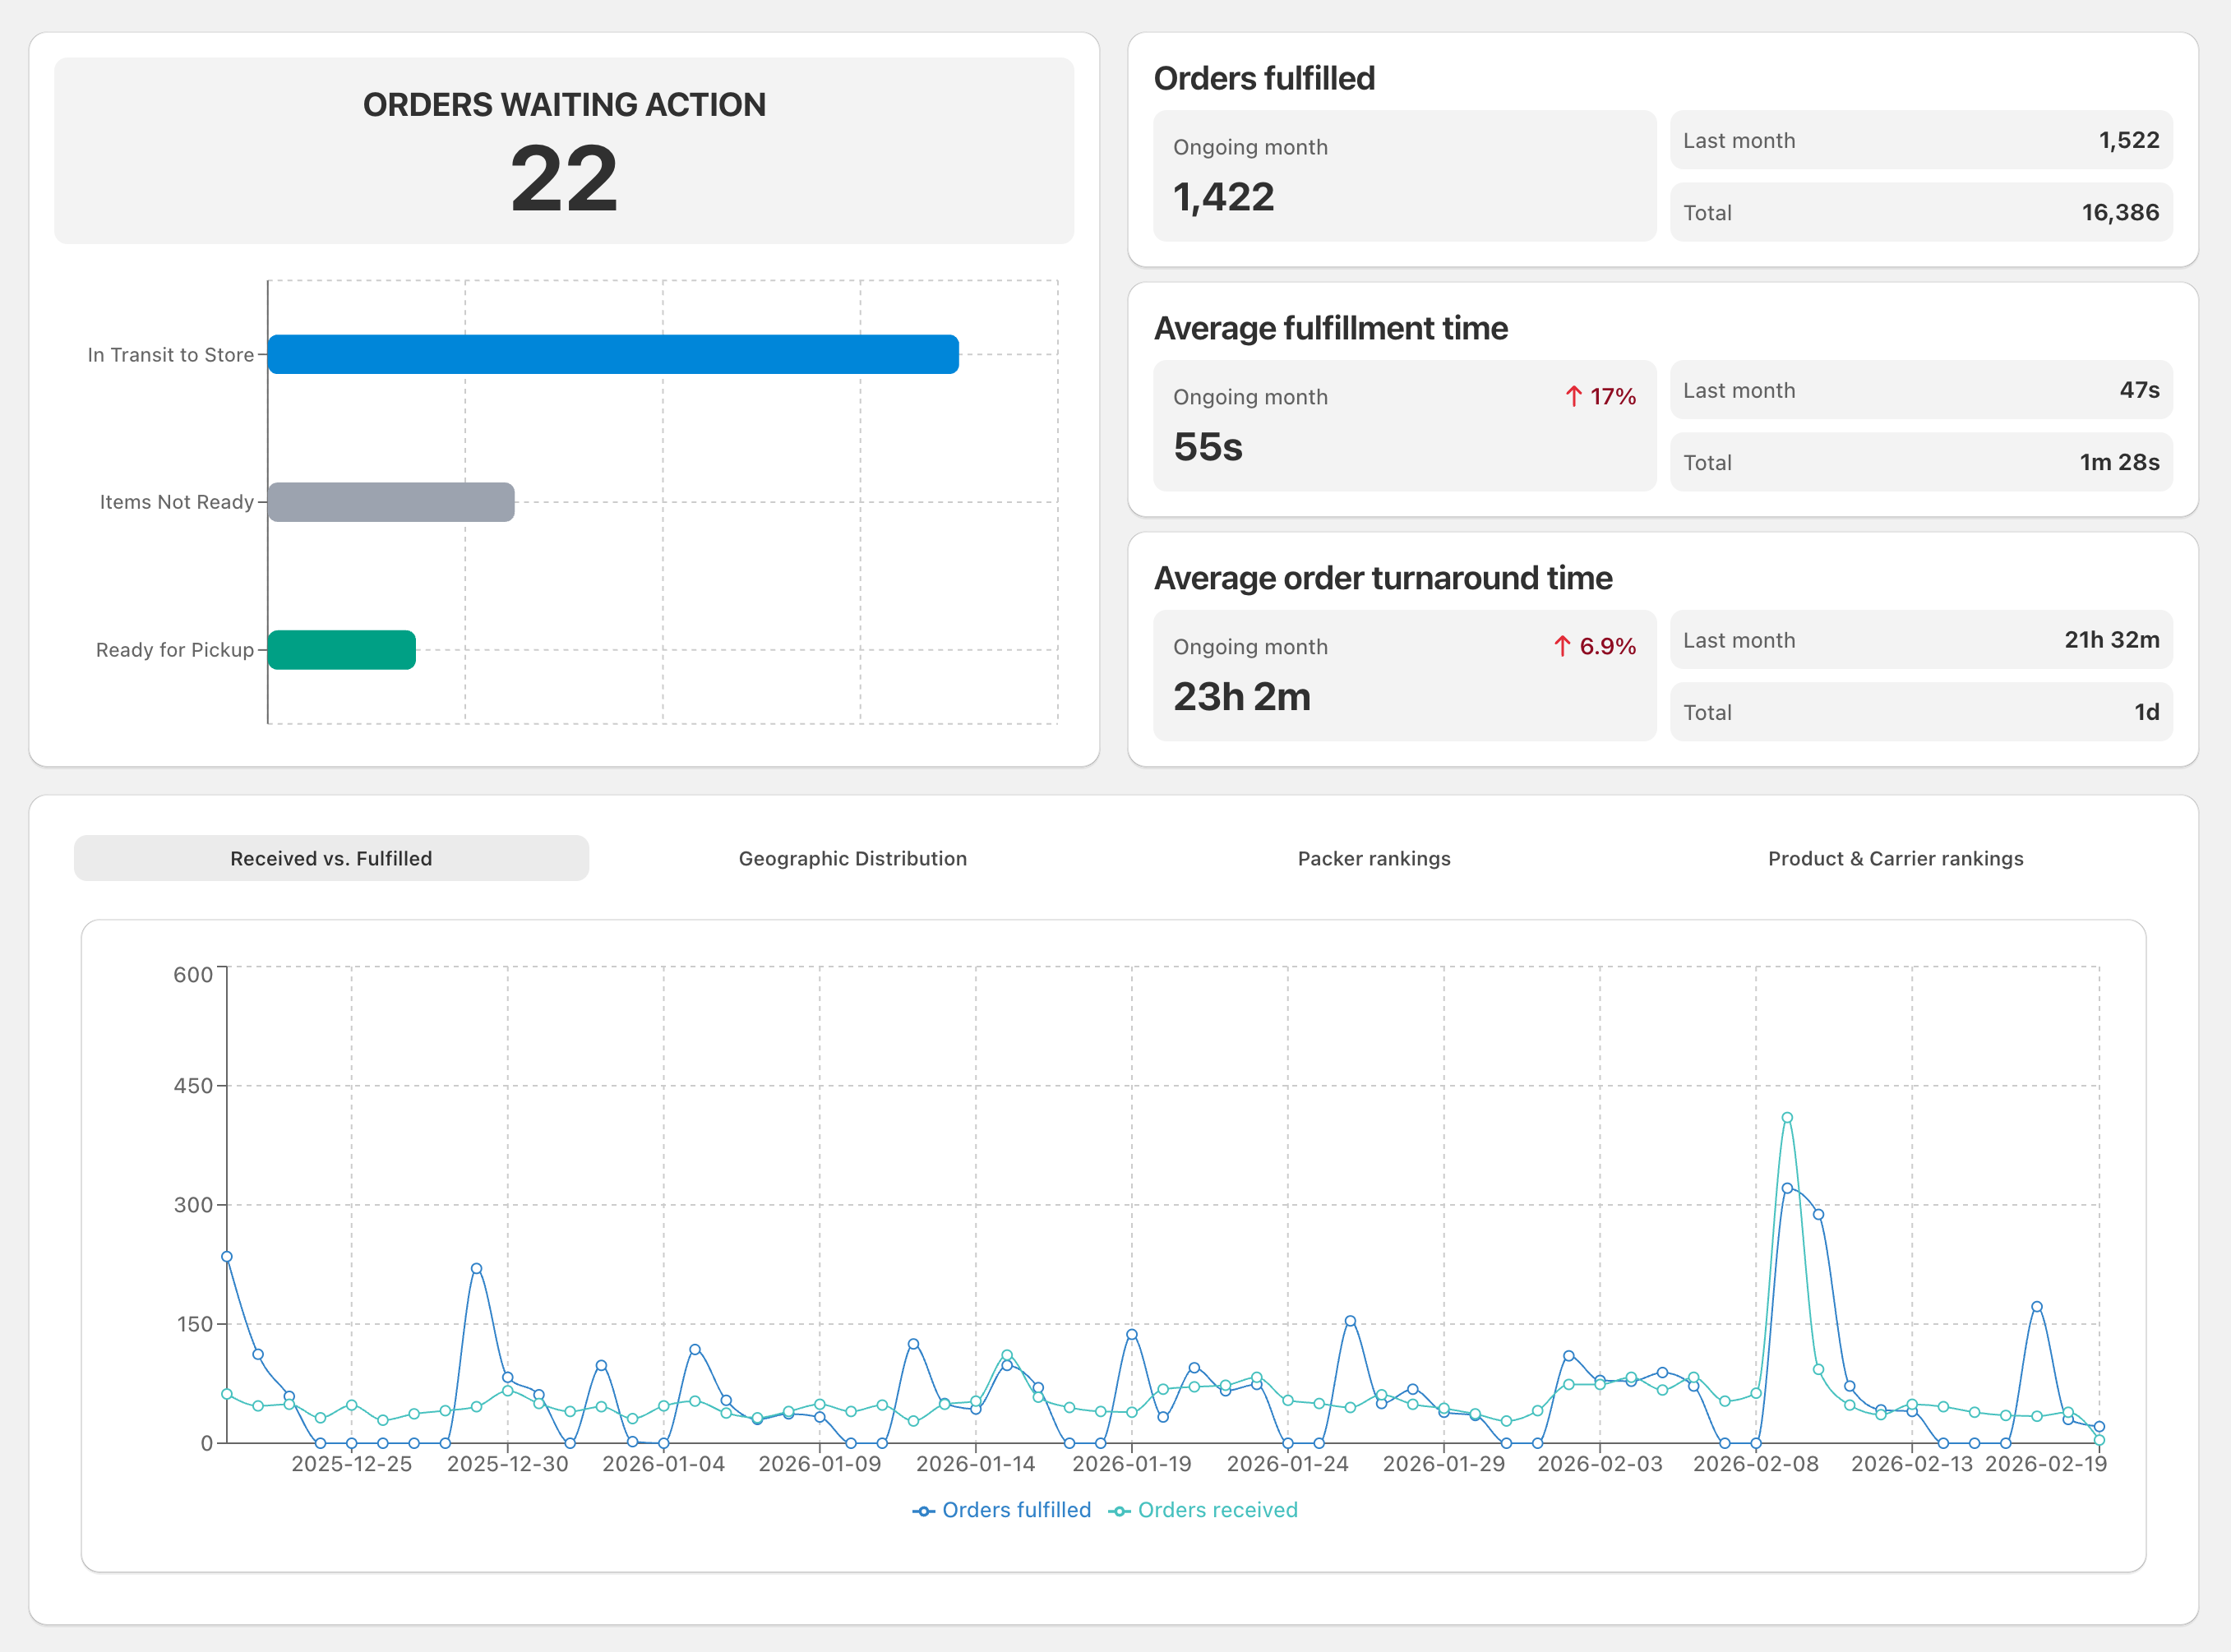
Four views
Every view a working warehouse needs
OrderKrab records every action on every order, then shows it four ways: by packer, by product, by order, and for the whole organization. Whatever you want to know, there is an answer.
Results for each packer
How many orders each person packs, their average time per order, how often they make a mistake, and how it changes over time. You can see who is doing well and who needs help.
Packer A against Packer B
difference in orders packed this month
+22%
Results for each product
Which products take the longest to pack, which cause the most scanning errors, and how that changed after you moved things around in the warehouse.
Slowest products
average packing time, SKU-1042
3:24
A timeline for each order
Every order has a full record: when someone took it, when each item was scanned, when the label printed, and when it was sent. You can follow it from start to finish.
Order #2145
from opening the order to printing the label
0:51
Numbers for the whole organization
Orders per day and per month, average packing time, the busiest hours, and comparisons between stores. This is the view a warehouse manager opens first thing in the morning.
This month
orders sent, 1.2× more than last month
8,420
Every order is recorded
OrderKrab records who packed each order and how long it took. You can open the timeline for any order and see who did what, and when.
The same data feeds the analytics for the whole organization, so you can see your results over time and compare teams or periods.
- Every action has a time and the person who did it
- Filter by action, packer, or store
- Down to each item: scanned, skipped, edited, returned
- Export to CSV for your own analysis
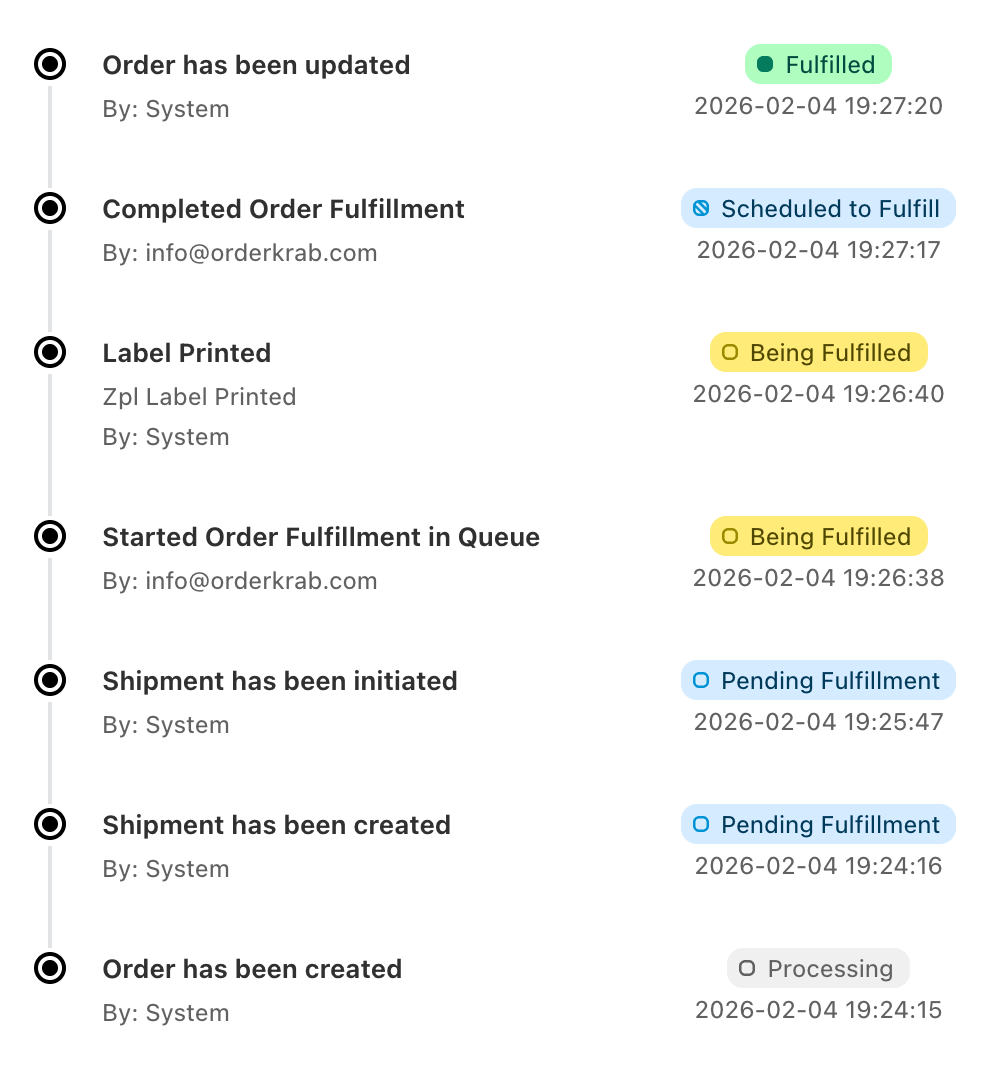
Every order knows who packed it
Open any order and see who took it, how long they spent, and what they did. You get a clear record without watching over anyone.
- Byfulfillment@mystore.com
- Start2026-02-04 19:26:38
- Finish2026-02-04 19:27:18
- Time taken39s
What you do with it
Data you can act on straight away
Analytics only helps if it changes what you do. Here are three things our customers do every week.
Find what slows you down
Sort products by average packing time and look at the slowest ones. Then move them closer together in the warehouse, or pack them in advance. The same view finds the order types that always take three times longer than the rest.
Help your team with real numbers
Compare each packer against the team average. Find where training helps. Often the cause is certain products, not the person. Then follow the improvement week by week.
Plan for the busy season
Decide how many people to hire for the holidays using last year's numbers and this year's pace. You can see exactly when you ran out of capacity, and plan for it before next December.